Hello everyone!
Sorry for missing last week's update. Life got in the way.
This week, I'd like to talk about statistics. A lot of statistics courses focus on how to apply techniques to problems. If you've studied any statistics, you're probably familiar with things like t-tests,  -squared values, and lots of other esoteric tools. But very few courses go into where those techniques come from or why they work. Today, we'll look at the normal distribution (or bell curve).
Let's begin with a simple game. Say we have a fair  -sided die. Then any number from one to six is equally likely to come up. We can represent this with a histogram, as below.
![]()
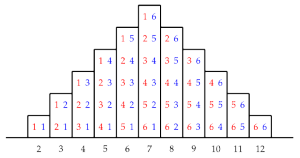
But a graph that flat gets kind of boring after a while. So let's say we have a pair of dice, instead. For the sake of convenience, let's make one red and one blue. There are  possibilities for each die, for at total of
  possible outcomes. Each of these is equally likely. Now let's look at their sums, as shown below. We can get any value from
  to
to  , but they're no longer equally likely. The numbers in the middle are a lot more likely than the ones at the end.
 Let's take it a step further and add a third die, as below. Or, better yet, roll a few hundred.
 If you've ever worked with statistics before, that shape probably looks familiar. It turns out that the more dice you roll, the closer the distribution becomes to a bell curve. There's a nice result, called the Central Limit Theorem, which says that if you add a lot of random variables (like the outcomes of each of the dice) together, the sum is normally distributed.
Now, you've probably heard that most data in the real world falls along a bell curve. Why might that be? Let's take as an example the height of people within a population. There are a lot of factors that affect height, such as genetic makeup, what you eat, the environment you live in, and so on. There are many possible values for each of these factors, so we can model each as a random variable. If we add together the effects of each, we have that height is the sum of many random variables. By the Central Limit Theorem, that means height is normally distributed, as are most real-word data.